Tag: OCI
-
Python + Folium + Oracle REST APIs (aka ORDS)
Willkommen I stumbled upon a new [to me] python library called Folium. It’s a mapping tool that enables python developers (or is it programmers, which is less offensive?) to visualize data on a Leaflet map. About folium Folium makes it easy to visualize data that’s been manipulated in Python on an interactive leaflet map. It…
Written by

-
Clean up a .CSV file with Regular Expressions, Pandas, and Python
I want to load data via Database Actions in my Oracle Autonomous Database, but first I need to clean up some Dates and Times. Python is my language of choice, and I’ve heard about Regular Expressions, but I’m scared…
Written by

-
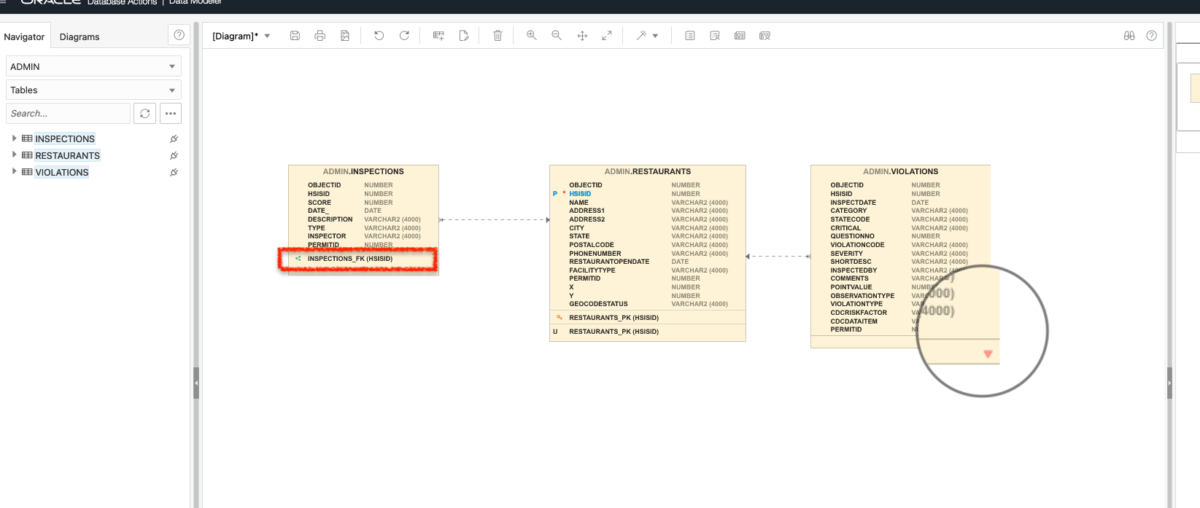
Add Primary and Foreign Keys to your Oracle Autonomous Database
I’m not a Database Administrator, but I feel as though I may be slowly evolving into one… In a previous post, I left myself the task of correcting the html on a proposed Python/Flask/ORDS/Autonomous Database application. My then next step was to add a search bar (which I did): Although this was a small step…
Written by
-
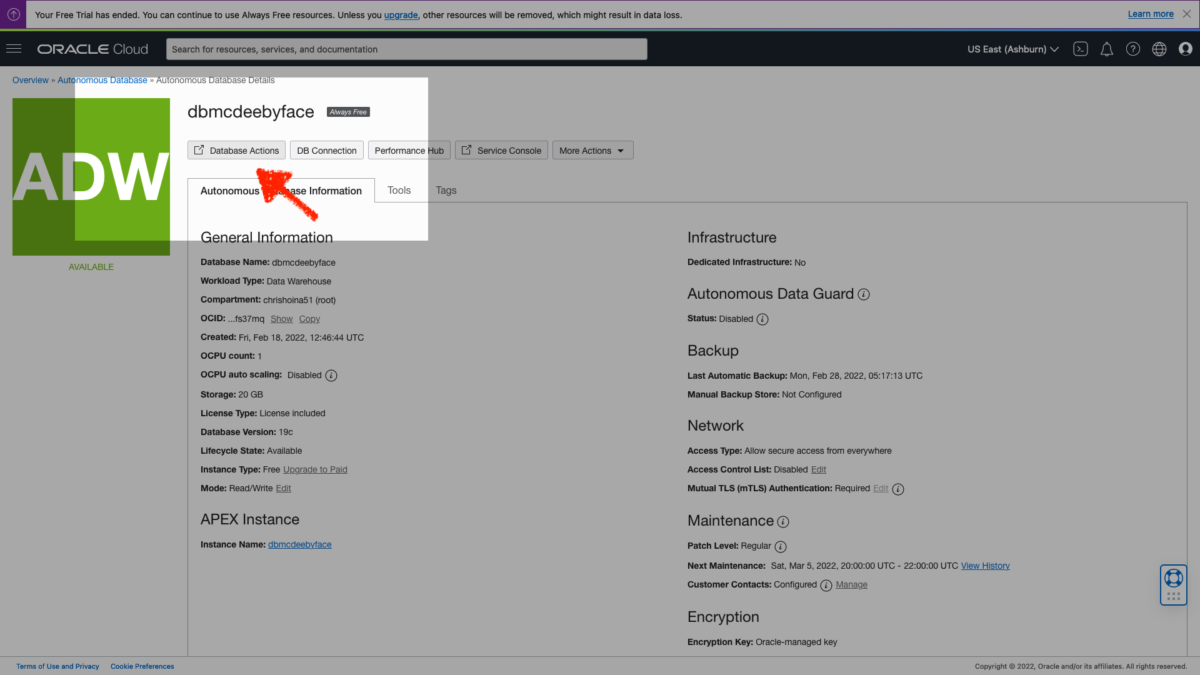
Create a user in Oracle Autonomous Database [for Dummies]
Creating an additional user in your Oracle Cloud Infrastructure (OCI) is not the same thing as creating an additional user in your Autonomous Database (ADB).
Written by
-
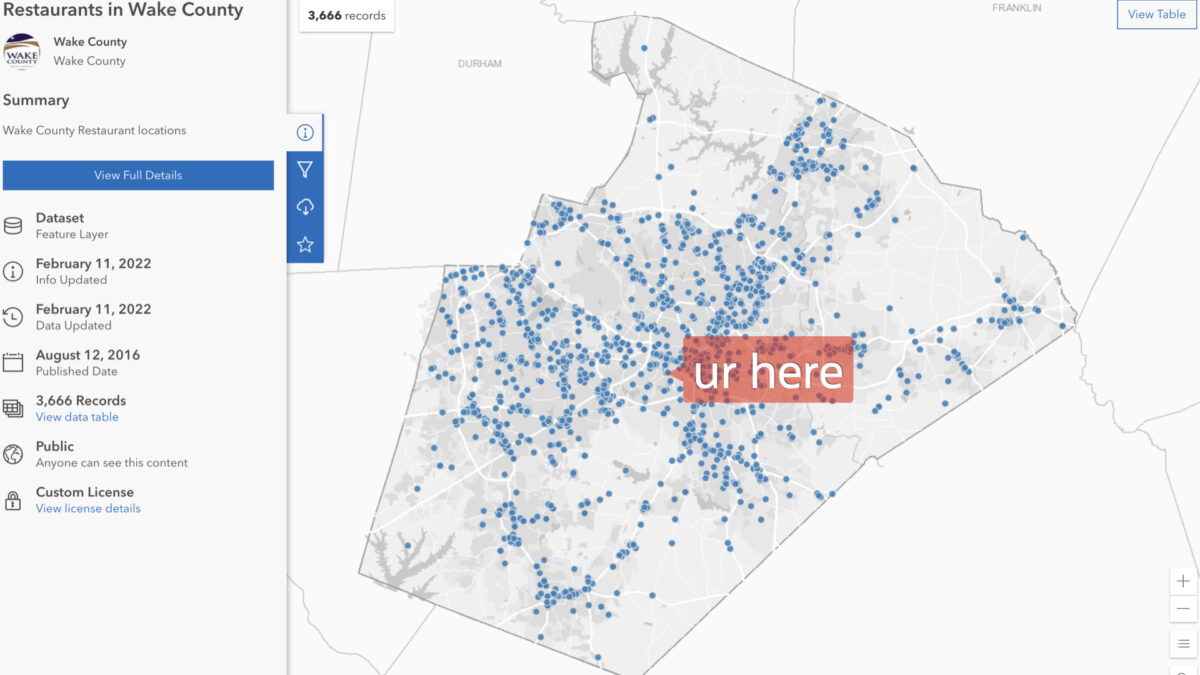
Table Prep: Data loads and time zones
With my Autonomous Database up and running,I needed to find some data to upload.
Written by
-
An Oracle Autonomous Database workshop: here is what I learnt
“…For someone who isn’t familiar with System or Database Administration, this was helpful and it made approaching ‘infrastructure’ so much more accessible and seemingly less daunting…”
Written by