Problem Description
You’re working with podman containers (maybe like me – the ones from the Oracle Container Registry), and when you execute the podman ps command, you see something like this in the standard output:
unhealthyIn this case, I already had another container with an Oracle 21c database; that one was healthy. I previously wrote up a tutorial on how I did that here. But when I attempted to create another container with the Oracle 23c Free database, this is where things went sideways. This new container would constantly display an unhealthy status 😭 (not working).
Why am I even doing this? Well, we have a bunch of cool new ORDS features that take advantage of the 23c database, and we want to start showcasing that more. It would be nice to be able to show this in containers.
Digging deeper
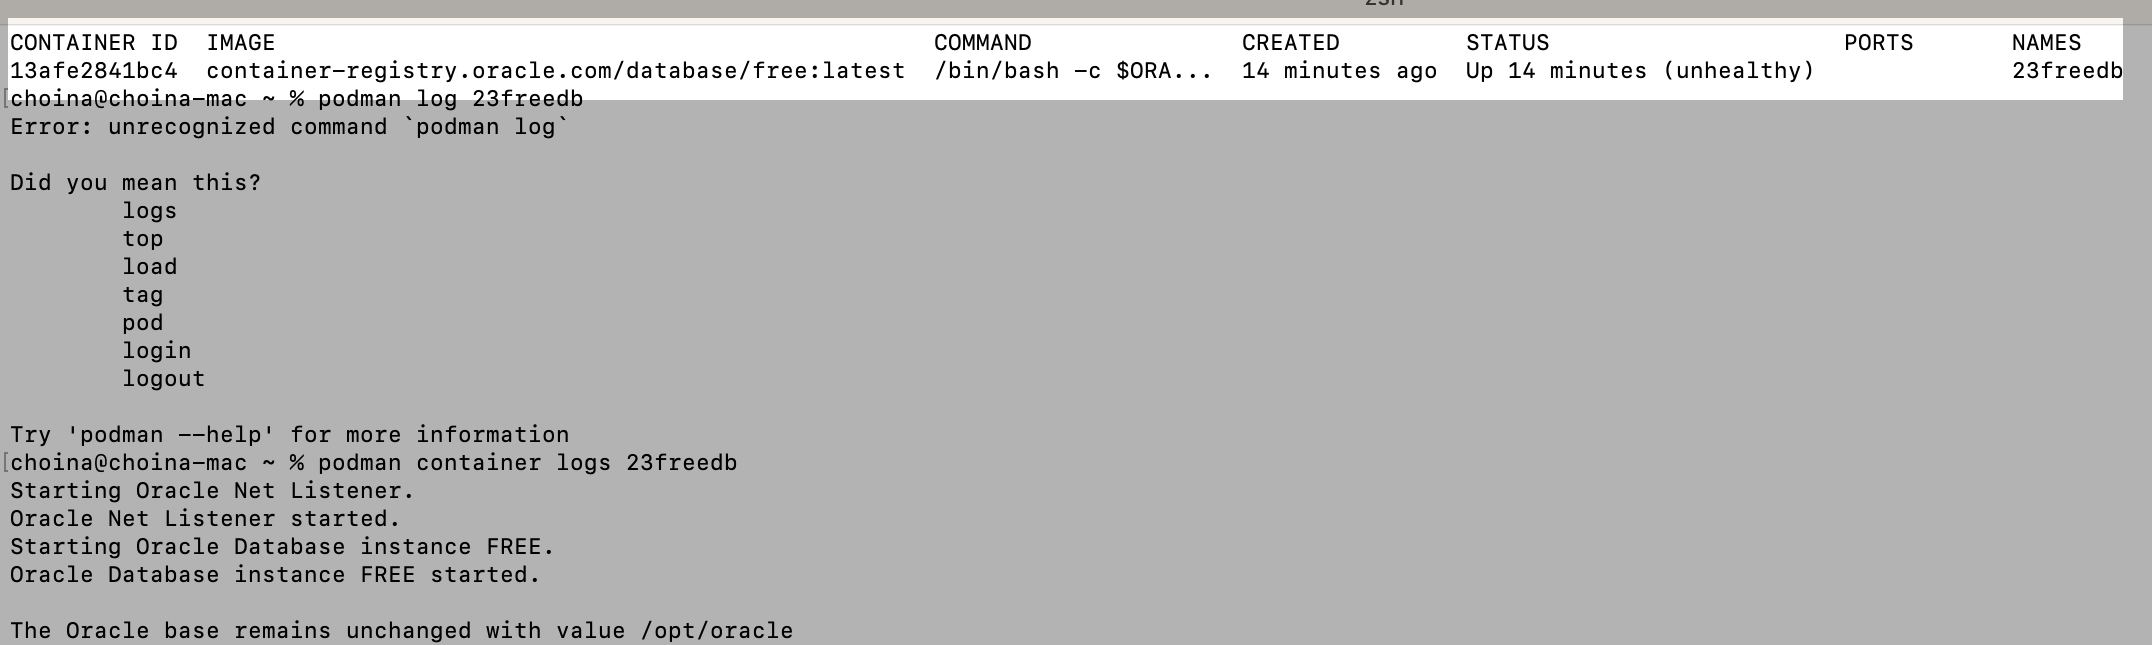
Issue the podman logs (not log, duh) command for this particular container. Very few details are revealed (technically, it does reveal relevant information, I just need to figure out what I’m looking at here).
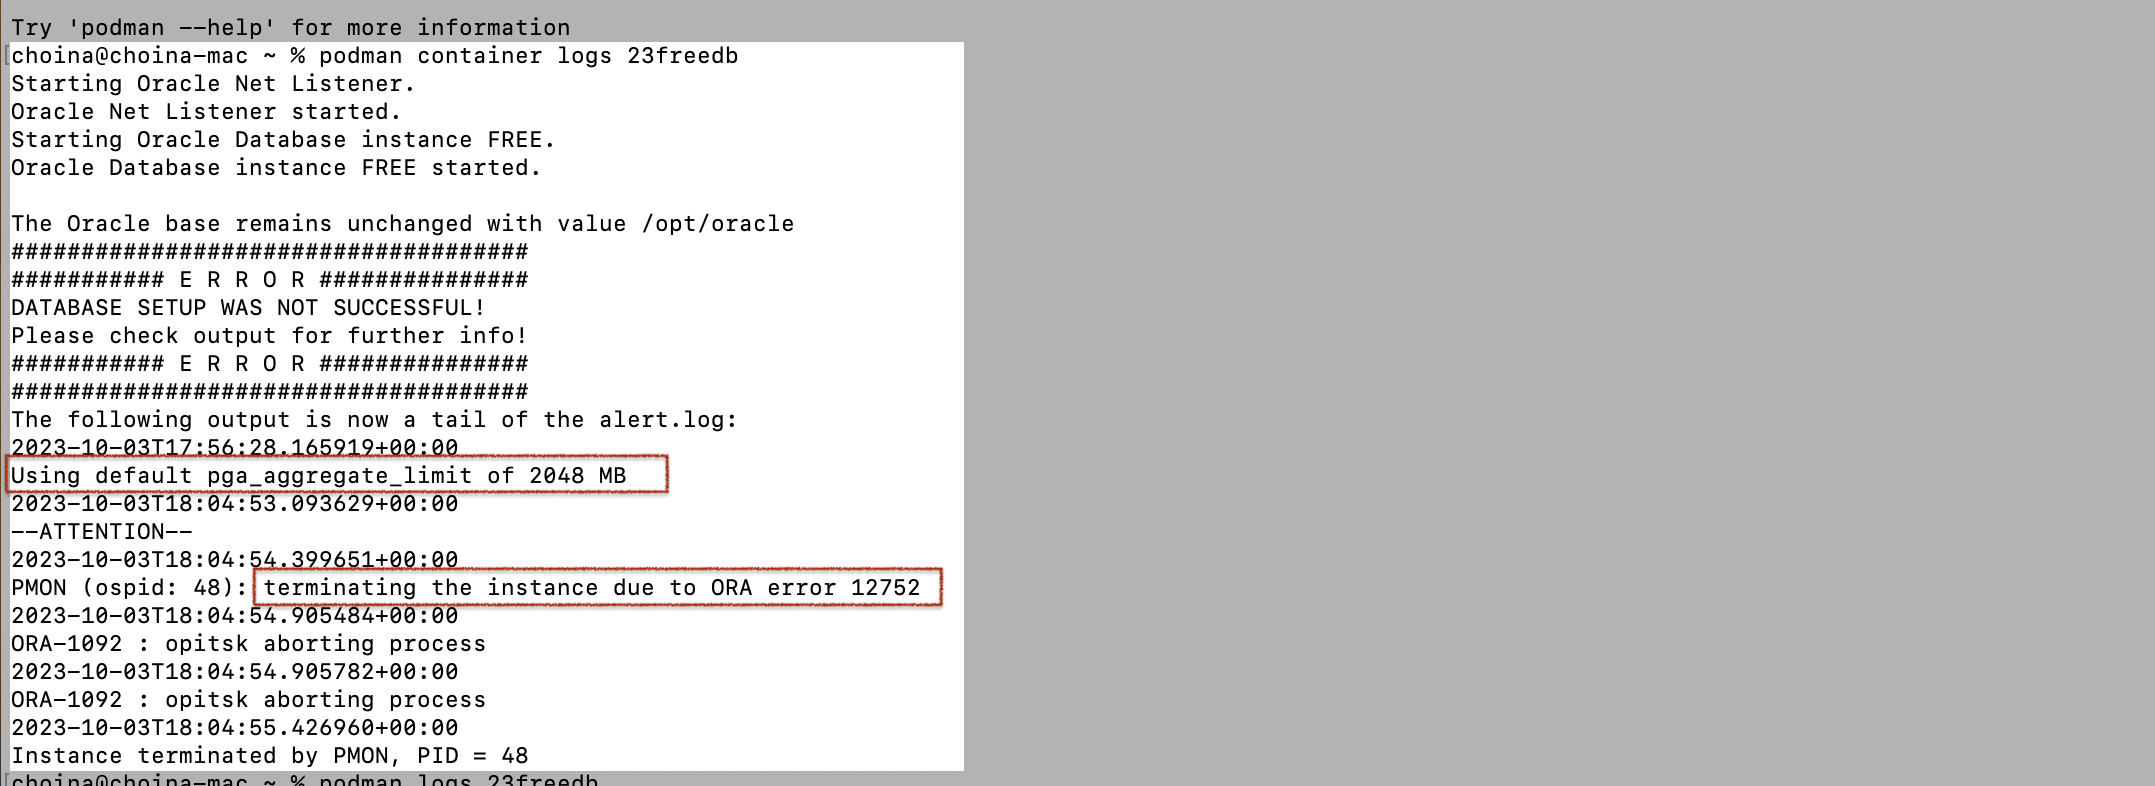
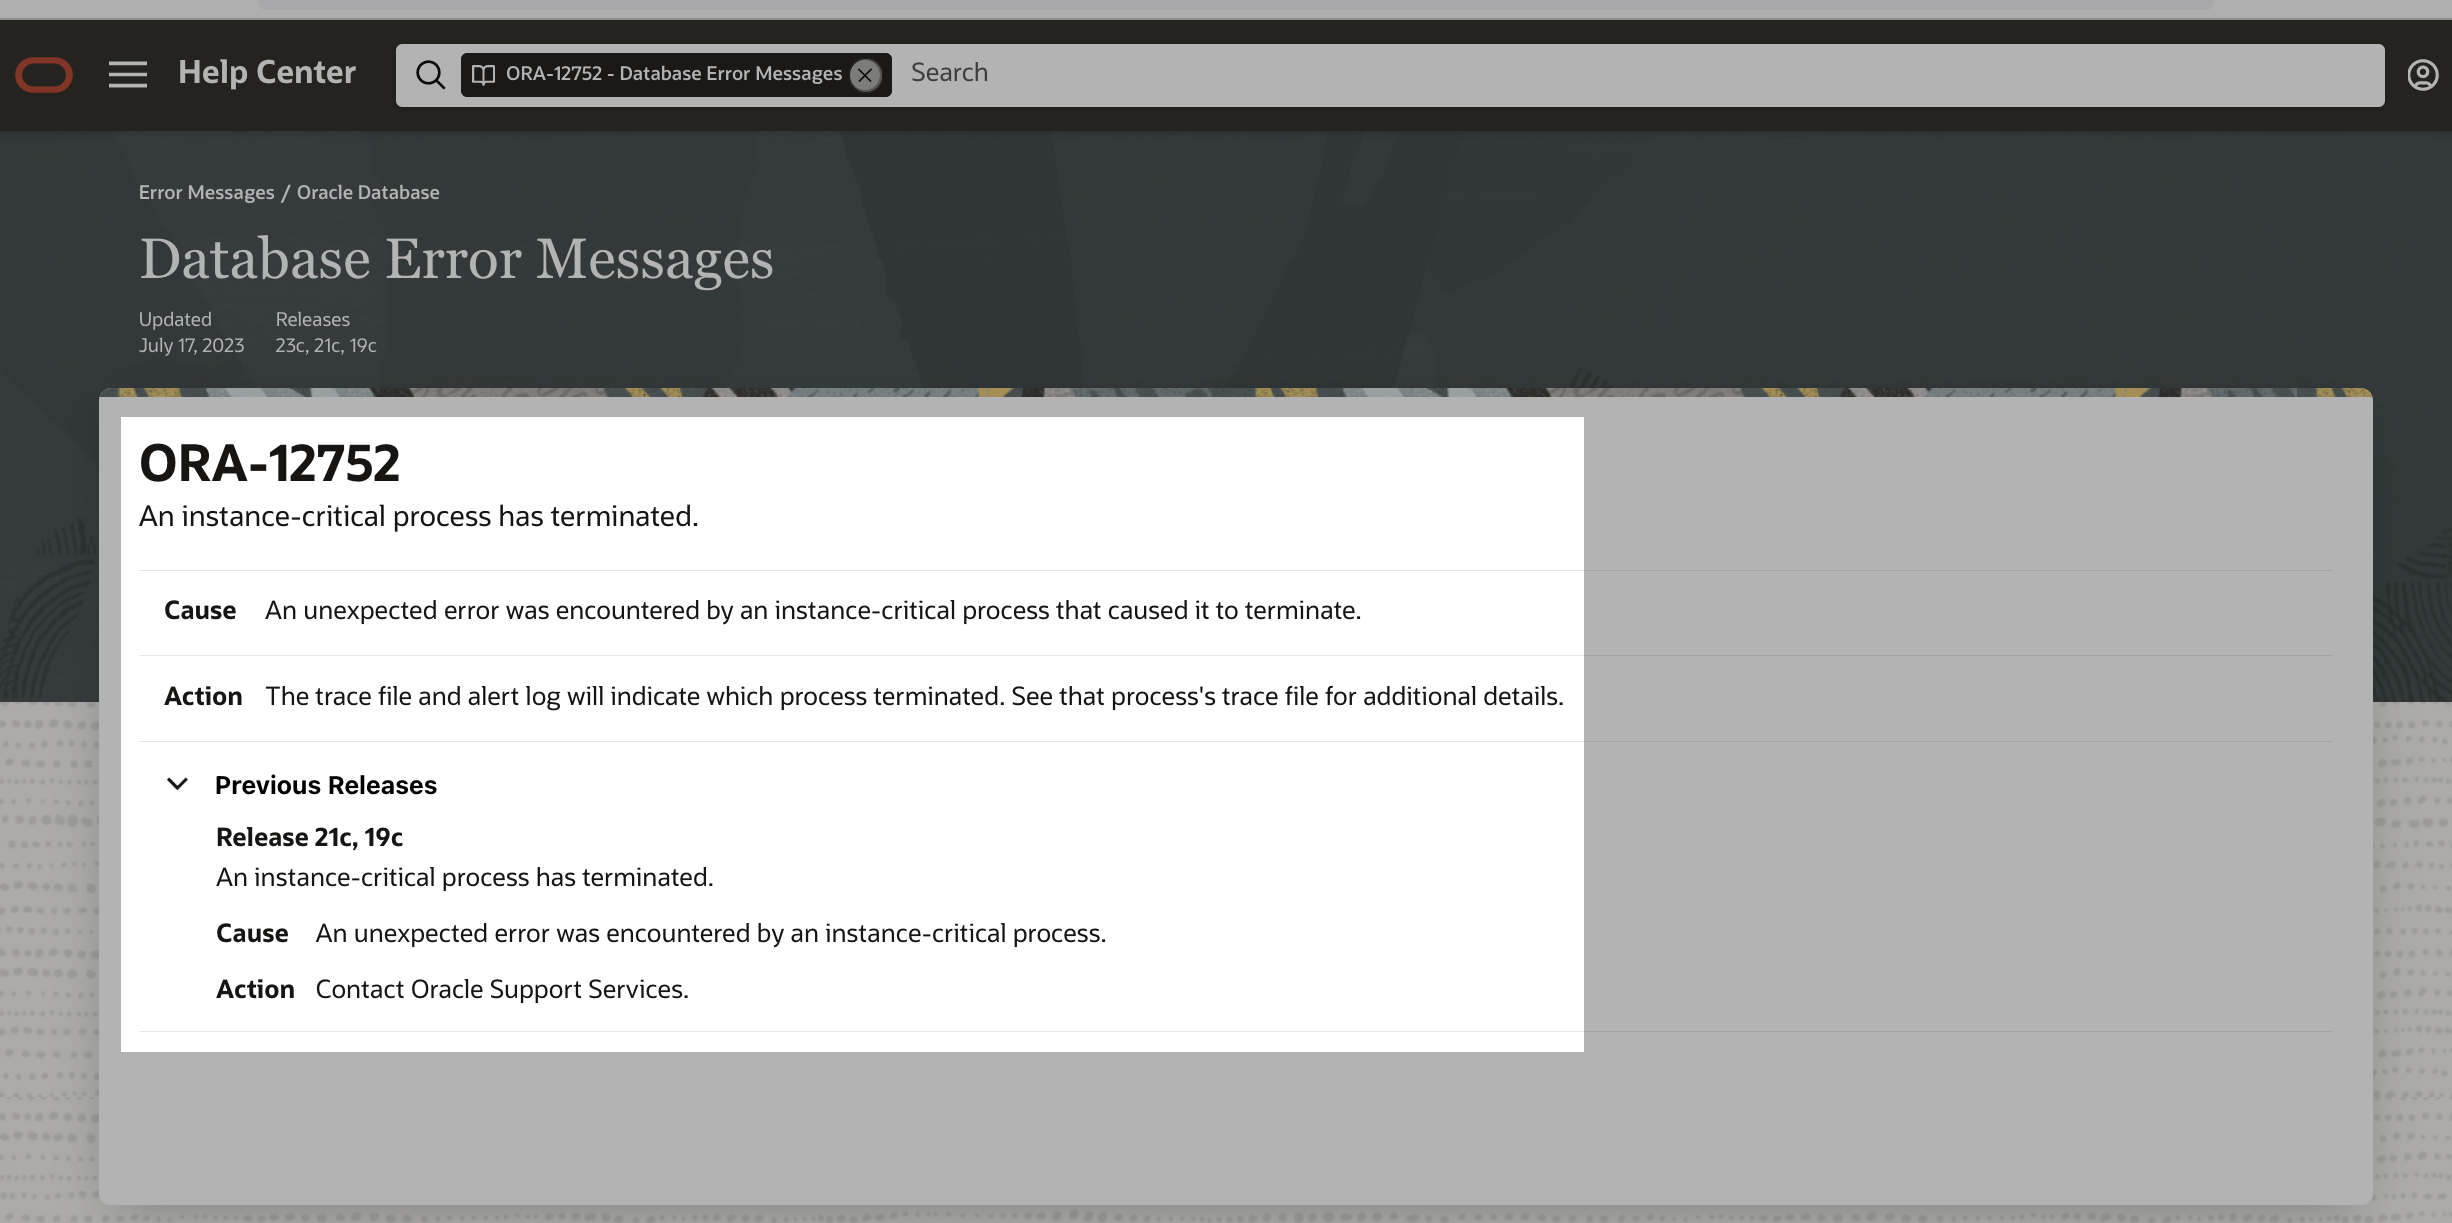
That ORA-12752 error message is…an error message.
You can clearly see that the database starts to provision, and then it just craps out1. I’ll spare you most of how we (I write “we” because this stuff is never really resolved by just one person) fixed this issue. But we finally figured it out; I’ll include some brief background. If you don’t care and want to see the resolution, then 👇🏼
1craps out is a technical term used by only the upper-most echelon of technical masters and internet luminaries.
Looking back, that Using default pga_aggregate_limit of 2048 MB line makes A LOT more sense now.
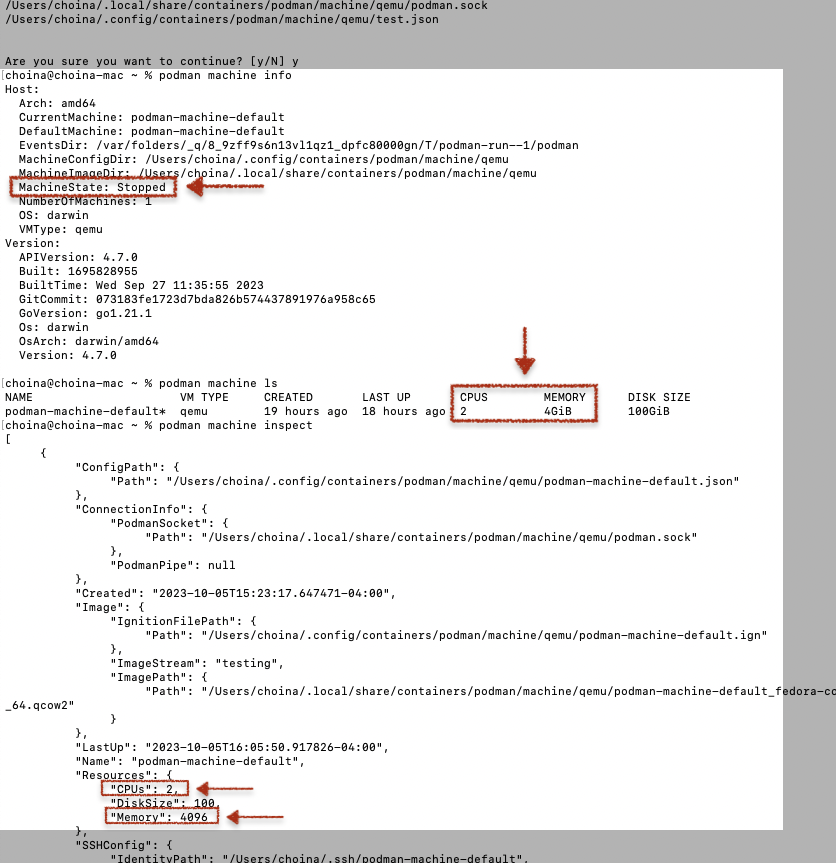
About podman machines
When you initiate a Podman machine, the default CPU and memory settings are 1 and 2048 MB (or 2,147,483,648 Bytes), respectively. I don’t see this in the documentation anywhere, but it is consistent with my assumptions when I created a second test podman machine with the default settings.
After a ton of reading online, tinkering with podman volumes, pouring through the open issues in the podman and Oracle container GitHub repositories, and bugging the hell out of Gerald, we finally figured out the problem. Gerald, quite astutely, asked to see my output from the podman info command.
REMEMBER...this is the output from the original default configuration of my podman machine. The one where I already had a 21c database container. So, briefly ignore that test podman machine.
choina@choina-mac ~ % podman info
host:
 arch: amd64
 buildahVersion: 1.31.2
 cgroupControllers:
 - cpuset
 - cpu
 - io
 - memory
 - hugetlb
 - pids
 - rdma
 - misc
 cgroupManager: systemd
 cgroupVersion: v2
 conmon:
  package: conmon-2.1.7-2.fc38.x86_64
  path: /usr/bin/conmon
  version: 'conmon version 2.1.7, commit: '
 cpuUtilization:
  idlePercent: 99.75
  systemPercent: 0.12
  userPercent: 0.13
 cpus: 1
 databaseBackend: boltdb
 distribution:
  distribution: fedora
  variant: coreos
  version: "38"
 eventLogger: journald
 freeLocks: 2046
 hostname: localhost.localdomain
 idMappings:
  gidmap: null
  uidmap: null
 kernel: 6.4.15-200.fc38.x86_64
 linkmode: dynamic
 logDriver: journald
 memFree: 1351737344
 memTotal: 2048716800
 networkBackend: netavark
 networkBackendInfo:
  backend: netavark
  dns:
   package: aardvark-dns-1.7.0-1.fc38.x86_64
   path: /usr/libexec/podman/aardvark-dns
   version: aardvark-dns 1.7.0
  package: netavark-1.7.0-1.fc38.x86_64
  path: /usr/libexec/podman/netavark
  version: netavark 1.7.0
 ociRuntime:
  name: crun
  package: crun-1.9-1.fc38.x86_64
  path: /usr/bin/crun
  version: |-
   crun version 1.9
   commit: a538ac4ea1ff319bcfe2bf81cb5c6f687e2dc9d3
   rundir: /run/crun
   spec: 1.0.0
   +SYSTEMD +SELINUX +APPARMOR +CAP +SECCOMP +EBPF +CRIU +LIBKRUN +WASM:wasmedge +YAJL
 os: linux
 pasta:
  executable: /usr/bin/pasta
  package: passt-0^20230908.g05627dc-1.fc38.x86_64
  version: |
   pasta 0^20230908.g05627dc-1.fc38.x86_64
   Copyright Red Hat
   GNU General Public License, version 2 or later
    <https://www.gnu.org/licenses/old-licenses/gpl-2.0.html>
   This is free software: you are free to change and redistribute it.
   There is NO WARRANTY, to the extent permitted by law.
 remoteSocket:
  exists: true
  path: /run/podman/podman.sock
 security:
  apparmorEnabled: false
  capabilities: CAP_CHOWN,CAP_DAC_OVERRIDE,CAP_FOWNER,CAP_FSETID,CAP_KILL,CAP_NET_BIND_SERVICE,CAP_SETFCAP,CAP_SETGID,CAP_SETPCAP,CAP_SETUID,CAP_SYS_CHROOT
  rootless: false
  seccompEnabled: true
  seccompProfilePath: /usr/share/containers/seccomp.json
  selinuxEnabled: true
 serviceIsRemote: true
 slirp4netns:
  executable: /usr/bin/slirp4netns
  package: slirp4netns-1.2.1-1.fc38.x86_64
  version: |-
   slirp4netns version 1.2.1
   commit: 09e31e92fa3d2a1d3ca261adaeb012c8d75a8194
   libslirp: 4.7.0
   SLIRP_CONFIG_VERSION_MAX: 4
   libseccomp: 2.5.3
 swapFree: 0
 swapTotal: 0
 uptime: 10h 20m 12.00s (Approximately 0.42 days)
plugins:
 authorization: null
 log:
 - k8s-file
 - none
 - passthrough
 - journald
 network:
 - bridge
 - macvlan
 - ipvlan
 volume:
 - local
registries:
 search:
 - docker.io
store:
 configFile: /usr/share/containers/storage.conf
 containerStore:
  number: 1
  paused: 0
  running: 0
  stopped: 1
 graphDriverName: overlay
 graphOptions:
  overlay.mountopt: nodev,metacopy=on
 graphRoot: /var/lib/containers/storage
 graphRootAllocated: 106769133568
 graphRootUsed: 45983535104
 graphStatus:
  Backing Filesystem: xfs
  Native Overlay Diff: "false"
  Supports d_type: "true"
  Using metacopy: "true"
 imageCopyTmpDir: /var/tmp
 imageStore:
  number: 2
 runRoot: /run/containers/storage
 transientStore: false
 volumePath: /var/lib/containers/storage/volumes
version:
 APIVersion: 4.6.2
 Built: 1694549242
 BuiltTime: Tue Sep 12 16:07:22 2023
 GitCommit: ""
 GoVersion: go1.20.7
 Os: linux
 OsArch: linux/amd64
 Version: 4.6.2
I included line numbers so you could more easily scan. Again, this output is from when I had a default podman machine. With this machine, I also had a 21c database container with a volume attached to it. I HAVE NO IDEA what the implications are of attaching volumes to containers (as far as memory is concerned)! I also don’t know what it does to the memory of the Linux virtual machine (what your podman machine actually is) 😬.
A closer look at the machine configuration
Take a look at lines 39 and 40; you’ll see
memFree: 1351737344
memTotal: 2048716800
1351737344 Bytes equals 1.35 GB, while 2048716800 is equivalent to 2 GB. That is consistent with what you see in the podman machine’s default settings. And given that I have a 21c database container with a volume attached, that used memory (696979456 or 0.7 GB) could, at least partly, be attributed to the existing container.
Aaaand…that earlier default pga_aggregate_limit of 2048 MB (read more here) line further supports the assumption that insufficient memory (in the podman machine) is the culprit. The way I read it, that database could consume as much as 2 GB of memory.
So, how could I expect to create another container of equal size in a machine that is only large enough to support one container?!
Myself
Resolving the unhealthy issue
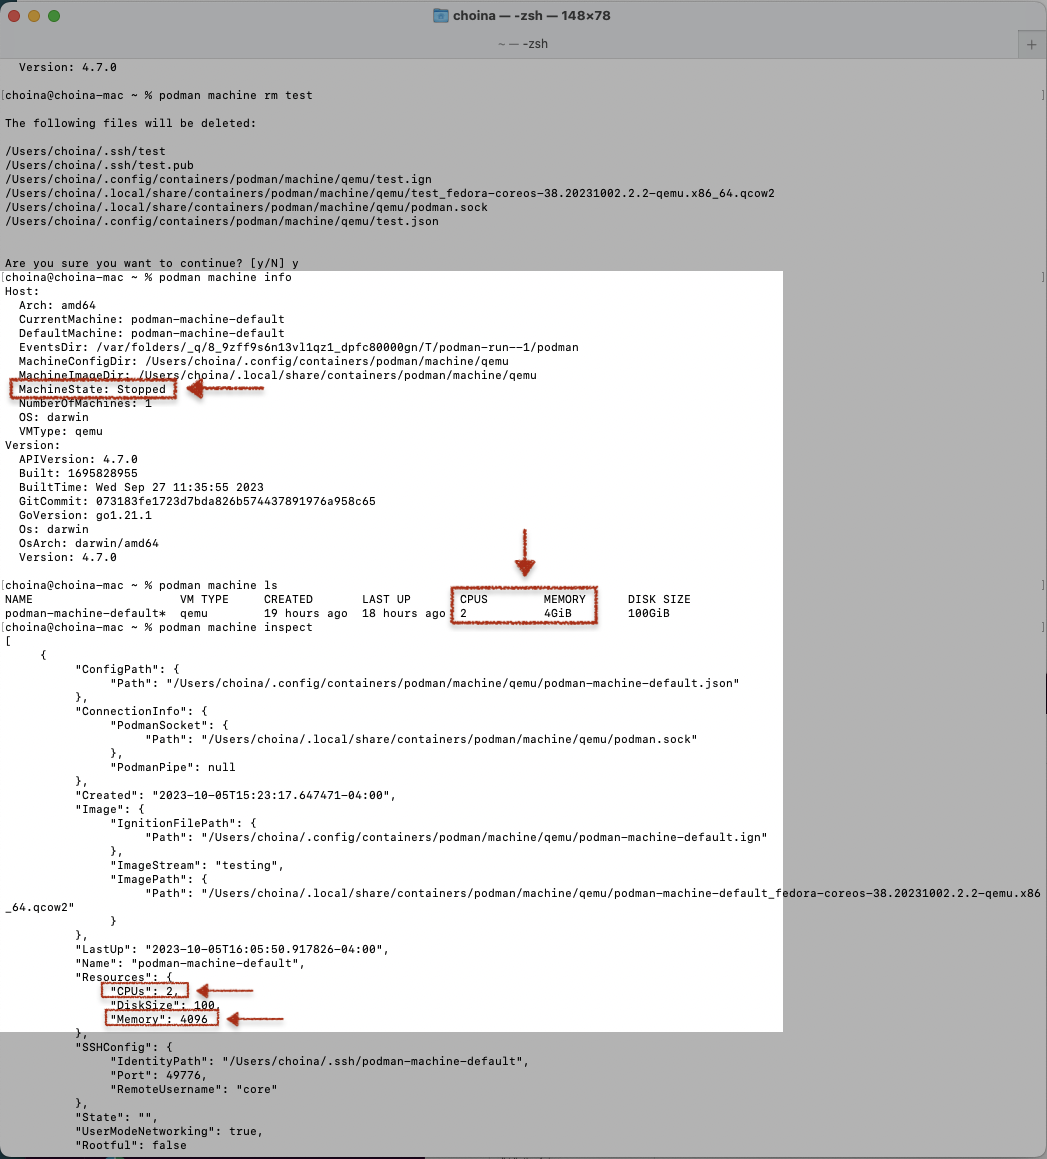
Well, after completely removing my podman machine, I re-initiated a new one with the following parameters (docs here):
podman machine init --cpus=2 --memory=4096NOTE: podman memory allocation is done in Megabytes. So 4096 Megabytes is equal to 4 Gigabytes.
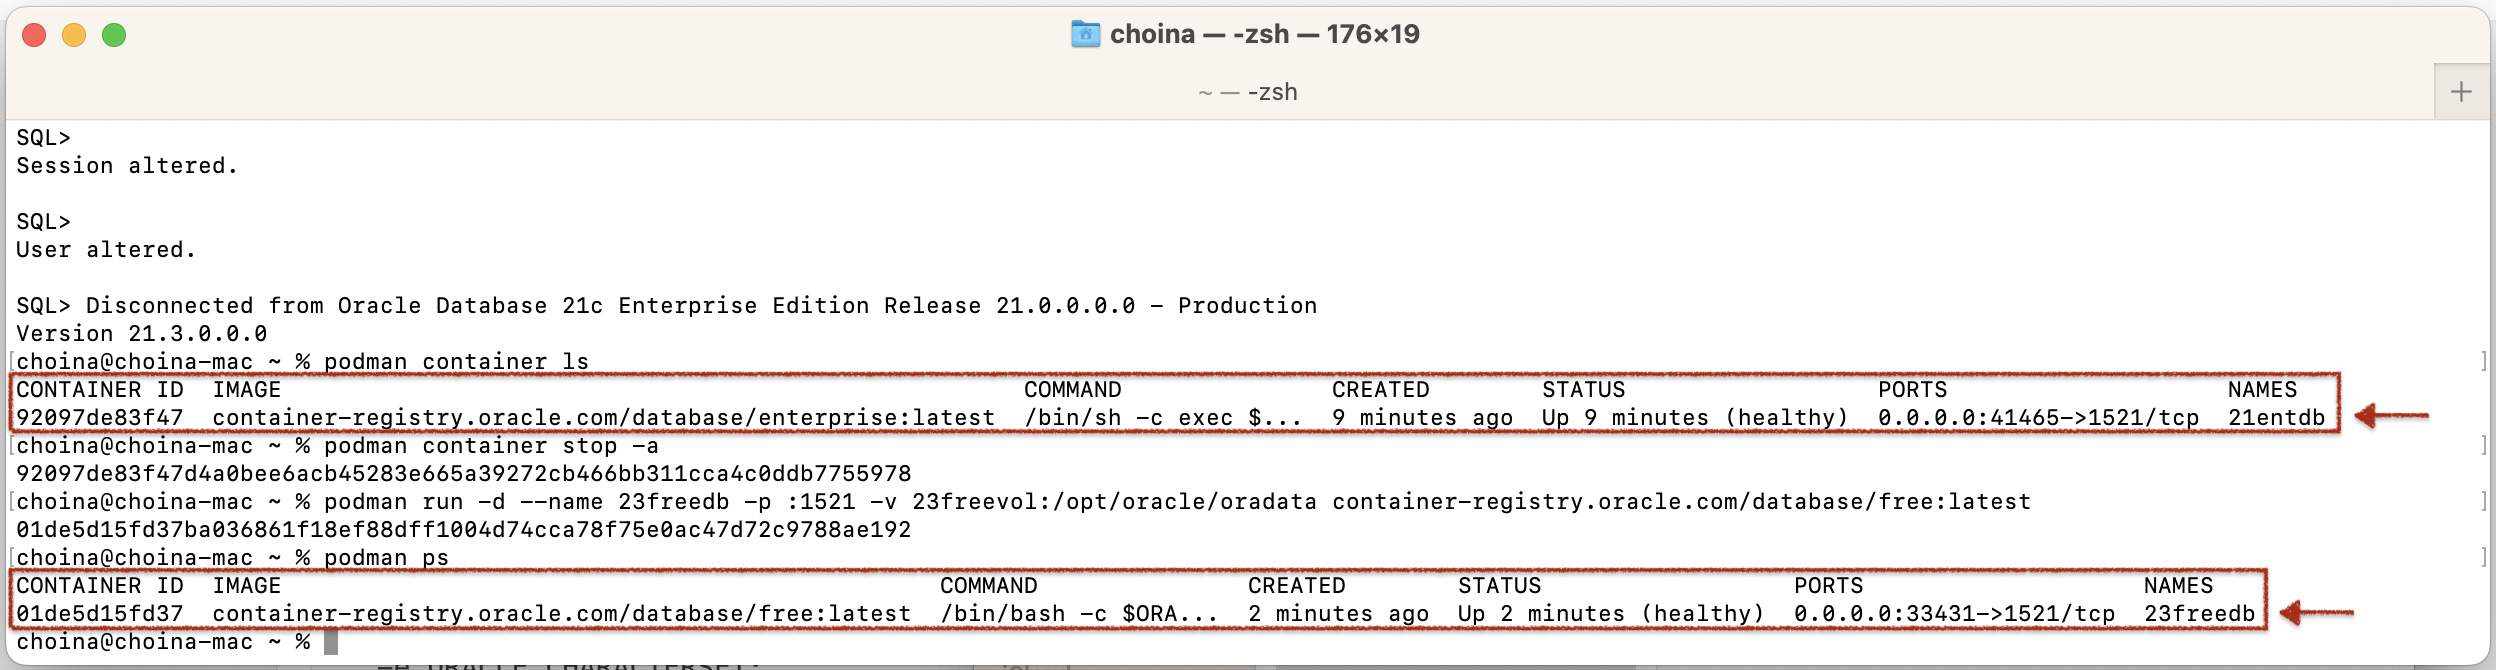
I then recreated two separate volumes, 21cvol, and 23freevol. From there, I created a container for the 21c database using the following command (sorry, I didn’t get a screenshot of this one):
podman run -d --name 21entbd -p :1521 -v 21cvol:/opt/oracle/oradata container-registry.oracle.com/database/enterprise:latestAnd then another for the 23c database:
podman run -d --name 23freedb -p :1521 -v 23freevol:/opt/oracle/oradata container-registry.oracle.com/database/free:latestAnd FINALLY, as you can see in the following image, both containers show a healthy status!
NOTE: I've yet to sign into either of these databases, and I still have to reinstall ORDS in each. So if you are following along, this is where I leave you.
Inspecting the new machine
And just for fun, I inspected the sole podman machine (after removing that temporary test machine) to review its configuration.
In conclusion
After about a week, I’m NOW ready to start working in the 23c container. We have some great new functionality and other ORDS stuff planned, too. I plan to start sharing that here!
One more thing
I’m bringing these findings up with the Oracle Container Registry team. I’ll probably share with the podman squad too. I feel I’m not alone in having trouble figuring out what the hell is going on under the covers.
If you found this useful, please share the post! This one is more of a Public Service Announcement than anything else. I can’t tell you how frustrating it is when you can’t figure out why something isn’t working.
Hey, I hope this expedites your misery, though 🙃!
Follow
And don’t forget to follow, like, subscribe, share, taunt, troll, or stalk me!
Leave a Reply